Exploration, statistics in practice, dashboards and visual communication of data.
Back to discovery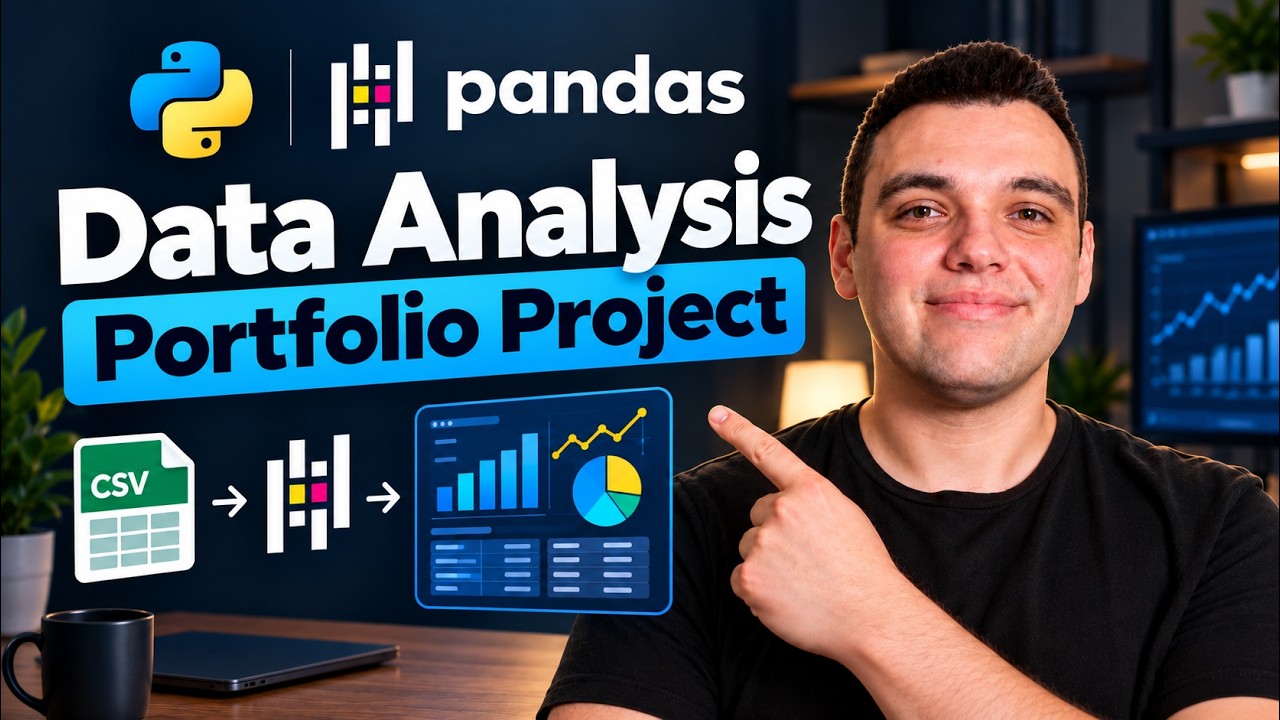 26:21
ABOUT THE CHANNEL Primary niche  Zubair Trabzada | AI Workshop172K
 AI Search767K
 Wes Roth333K
26:21Technology & Computing / VIDEO Onur Baltaci· 20.3K subscribers
Exploratory Data Analysis with Python | Data Analyst Portfolio Project (E-Commerce Dataset)
Onur Baltaci· 20.3K subscribers25d ago · English audio
In this Data Analyst Portfolio Project, we perform a complete Exploratory Data Analysis (EDA) on an e-commerce dataset using Python and popular data analysis libraries. You’ll learn how to clean, explore, analyze, and visualize e-commerce data to uncover meaningful patterns, trends, and insights from real-world shopping data. Throughout the project, we use Python, Pandas, NumPy, Matplotlib, and Seaborn to…
Onur Baltaci
Hello! I'm Onur. Welcome to my Data Science channel. On my channel, I share videos about Data Science, from Python and SQL to Data Analysis, Machine Learning (ML), and Artificial Intelligence (AI). Whether you're just starting out or already have some experience, you'll find tutorials, courses, and hands-on projects that can help you level up
7.9×Score at discovery
6KViews
757Median · 34 videos
Outlier score
This score was measured on Sun, 25 Oct 2026 16:17:53 GMT. Current view counts may differ.
6K views ÷ a 757 baseline = 7.9×. Compared with 34 earlier videos from the same channel, matching the format recorded at scoring time. Older-upload baseline: reference videos had at least as long to gain views. This comparison is not age-matched.
YouTube snapshot: Sun, 25 Oct 2026 19:39:00 GMT. Counters may have changed.
Read the methodologyArtificial Intelligence & Data
Channel-balanced percentile: 42
Comparison details
85 videos from 54 other channels, with each channel weighted equally. Same format and language, with 10,000–99,999 subscribers. Observed at 605 hours after publication, within ±48 hours.
The comparison uses this broader topic because the specific niche has too few examples. This describes the collected sample, not all of YouTube. Updated Sun, 25 Oct 2026 19:51:32 GMT.
Niches & tags
Transcripts and detailed analytics are available for recent outlier Shorts up to three minutes. Research tools
Breakouts from other channels
8.2×318.9 views / hour
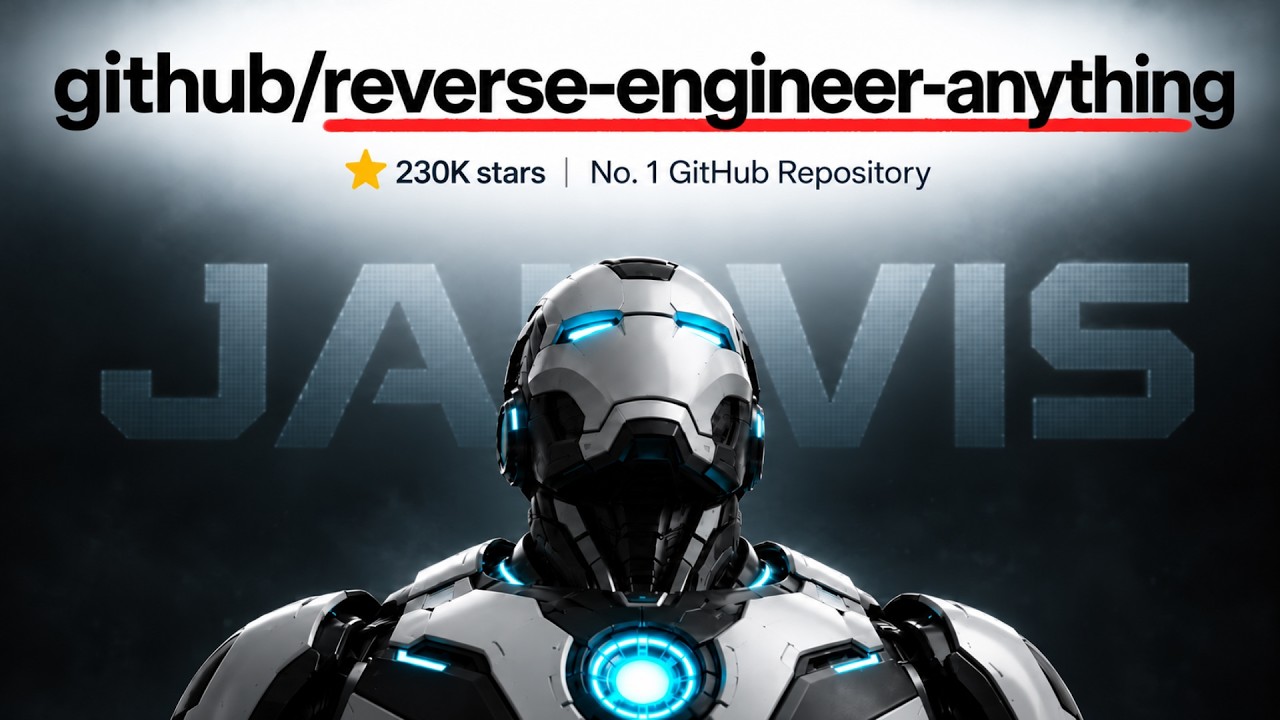
Percentile 100 · Generative AI & AgentsI Gave My AI Assistant the Power to Reverse Engineer ANYTHING!
Zubair Trabzada | AI Workshop172K
3.4×
Score at discovery · 2026-10-25
Percentile 100 · Generative AI & AgentsDeepseek strikes again
AI Search767K
3.8×
Score at discovery · 2026-10-25
Percentile 100 · Generative AI & Agentsthey’re shutting it DOWN
Wes Roth333K